

Strategic Investing, in our opinion, entails crafting a robust, risk-adjusted model that relies on asset allocation to yield superior long-term results with reduced risk. Successful implementation involves not just tactical execution at the asset level, but also strategic allocation and continuous rebalancing, factors crucial for sustained outperformance.
2023 is over and we experienced relatively strong returns across equity and fixed income markets. Both the traditional 60/40 portfolio* and traditional balanced funds in Canada delivered close to double-digit returns, surpassing our own Nicola Core Composite (Core), which ended 2023 up 5.18%. Whereas the traditional 60/40 Model (minus 1% management fees) saw an annualized return of 9.7% and Morningstar Canadian Neutral Balanced (Morningstar)* representing “traditional balanced funds” ended the year at 7.98%. Does this mean that traditional equity and bond portfolios investing in public markets are now back in vogue? We don’t think so. In this newsletter, we will dissect these trends and shed light on why the landscape of public market investing might not be as straightforward as recent performance suggests.
If we go back to the beginning of 2022 and consider returns for the last two years, we can see that even if an investor was willing to allocate 100% of their portfolio to equities, it would have underperformed the Nicola Core Portfolio Fund significantly, all while assuming a considerably higher level of risk.


The table above shows returns from January 1st, 2022 to December 31st, 2023. The first row compares the annualized returns of the Nicola Core Composite with the Morningstar Canadian Neutral Balanced index (Note: The Morningstar Canadian Neutral Balanced Index is a proprietary index created by Morningstar Canada, derived from the CIFSC Fund categories - cifsc.org.) As you can see, the difference exceeds 7.5% per year or cumulatively more than 15% over two years (almost $500,000 on a $3 million-dollar portfolio). The other major difference is the amount of risk required to achieve these results, measured by two different measurements.
The first metric is the Standard Deviation (SD) of the portfolio. A lower SD indicates less volatility and thus lower risk. In the case of Core, the SD is 2.21%, or about 70% lower than the 9.23% for Morningstar Neutral Balanced Index. Core also outperformed the TSX, the S&P 500, and the MSCI over this period, with even lower relative SD numbers.
The second risk measurement is maximum drawdown, representing the biggest drop in a portfolio or index from its highest point to its lowest point in the measured period. Over the last two years, Core’s maximum drawdown was under 1%, while Morningstar’s was 11.72% and the S&P 500’s was more than 18%. This volatility has a measurable impact on client returns and negatively influences investor behaviour, as outlined below.
How do these results compare when longer time frames are used? One can see below that over 3, 5 and 10-years Core has consistently performed better than either 60/40 or Morningstar Neutral Balanced.


There are several charts and we have added our observations. Let’s start with just how well the S&P 500 has performed over the last year or so. Our focus on using the S&P 500 is due to its scale and dramatic recovery in 2023. As the chart below indicates, it is up more than 20% for the last 12 months, even though the first week of 2024 was slightly negative. However, there is a lot more to consider than just one single year.


If we look at the equal-weighted index for the S&P 500, it reveals a 3.5% decrease today compared to two years ago. Equal weighting adjusts results to account for the significant impact of seven large tech stocks, referred to as the “Magnificent 7,” on the overall index performance. Even when considering the entire S&P 500 plus dividends, the cumulative return for the last 24 months is just over 3%. In contrast, Core achieved over a 15% return during the same period and with a fraction of the volatility.


A primary focus in our portfolio construction is to have a significant portion of the total return come from cash flow or income rather than relying solely on capital appreciation. Income from major asset categories, such as stocks, bonds, and real estate, tends to be more stable than price. We aim to secure approximately 50% of our clients’ total return from cash flow.
When we examine the yield of the S&P 500, it has now dropped to less than 1.5%. The lower dividend yield is the result of higher prices for shares and not lower earnings for companies. If the S&P 500 were to return a yield of 2%, the index would need to experience an almost 30% fall.


Even though earnings for the S&P 500 have not fallen in absolute terms, the Shiller PE ratio, standing at almost 32x, is notably higher than the median level of 17. These stocks are not cheap. Even when we look at nominal PE ratios for the S&P 500, we can see that over the last year, they have risen significantly.


One key element in creating wealth is striving for the best risk-adjusted returns. Absolute returns do not mean much if they require a great deal of risk to realize them. The Morningstar chart below shows that over the last ten years, the S&P 500 realized a return of 10% annually before fees, with a standard deviation of 15.17. This means that 2/3 of the returns during this period were 10% +/- 15.17%, indicating volatility between -5% and +25%. The worst drawdown in this period was -24.77%. If we go back to January 2000 the S&P 500 total return is just under 7% a year, or slightly less than our average client return, as represented by Core. On average, our clients, as represented by Core, have not had more than 40% exposure to the higher volatility of stocks.


This brings me to one of my favourite topics, Behavioural Finance. There is a large gap between the theoretical returns of markets and the actual results of investors. The chart below perfectly describes investor behaviour over the last two years and is supported by the following quote derived from Dalbar’s March 2023 study on investor performance for 2022 results:
“The Average Equity Fund Investor lost over one-fifth of their account balance during 2022. Equity investors lost 21.17% during the year against an S&P 500 equity index that lost 18.11%. This represented an investor gap of 3.06%.”


This phenomenon is not just related to a one-year bear market. Dalbar studies show the gap between market results and investor outcomes has been just under 3% per year for the last 13 years.
Morningstar has recently completed its study of investor behaviour covering the last five years and in their latest commentary called Mind the Gap their analysis suggests that investor behaviour reduces returns over buy and hold by 1.7% /yr.
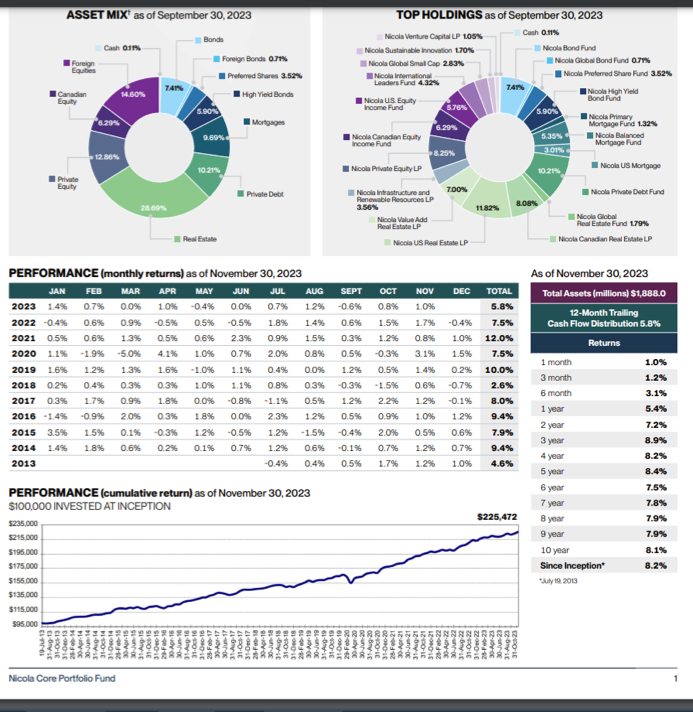
This brings us to Core. The charts below show results for Core over more than ten years, revealing:
- 10-year (to November 30, 2023) returns of 8.1% per year.
- No negative returns over any year, even during the decade when the S&P 500 had a maximum drawdown of almost -25%.
- A significant portion of the returns is generated by cash flow, typically three times the level of the current S&P 500 yield.
- Greater diversification of asset classes.
- Our clients’ actual results, as represented by Core, are almost identical to the Nicola Core Portfolio Fund, indicating there is no drag on returns caused by our clients’ financial behaviour.

How does this all compare to the public balanced model represented by Morningstar Neutral Balanced over the last 1, 2, 3, 5 and 10 years?


Returns have been higher, and risks have been lower for Core, whether measured by Standard Deviation or Maximum Drawdown for each period shown. The differences are even more significant against pure equity indices, which should outperform balanced portfolios over longer time frames. The table below, dating back to December 31st, 1999, measures the actual results our clients have achieved net of fees, as represented by Core (as opposed to a theoretical portfolio or index) with Morningstar, the TSX composite, the S&P 500 in Canadian dollars (CAD), and the MSCI in CAD.
Observations we can make from this table:
- Core returns are higher than the rest and almost 2.7% higher than Morningstar Neutral Balanced.
- Both the S&P 500 and the MSCI indices, when denominated in CAD, would have experienced a peak in their portfolio value in 2000, taking until 2009 to bottom.
- It took until 2013 for both portfolios to recover to their 2000 peaks (more than 13 years).
- During that time, the maximum drawdown was over 44% for MSCI, 43% for the TSX and 51% for the S&P 500.


These results pose a question: How many investors would have held onto their equity positions while experiencing such heavy losses for such an extended period?
The Nicola Core Portfolio Fund is a good example of strategic investing, a version of which can be found in some of the best pensions, foundations, and family offices globally.
This material contains the current opinions of the author and such opinions are subject to change without notice. This material is distributed for informational purposes only. Forecasts, estimates, and certain information contained herein are based upon proprietary research and should not be considered as investment advice or a recommendation of any particular security, strategy or investment product. Information presented here has been obtained from sources believed to be reliable, but not guaranteed.
*The traditional 60/40 portfolio is a custom benchmark comprising: Citi World Government Bond less 19bps fee (Weight 16%), FTSE TMX DEX Universe Bond less 33bps (24%), MSCI World less 46 bps fee (24%) , S&P TSX Composite less 17 bps fee (36%). Morningstar Canadian Neutral Balanced is a proprietary index developed by Morningstar Canada based on the CIFSC Fund categories (www.cifsc.org). This index includes funds which meet the following criteria: Funds in the Canadian Neutral Balanced category must invest at least 70% of total assets in a combination of equity securities domiciled in Canada and Canadian dollar-denominated fixed income securities and between 40% and 60% of their total assets in equity securities.
Past performance is not indicative of future results. All investments contain risk and may gain or lose value. Returns are net of fund expenses charged to date. This is not a sales solicitation. This investment is intended for tax residents of Canada who are accredited investors. Residency restrictions apply. Please read the relevant documentation for additional details and important disclosure information, including terms of redemption and limited liquidity. Please speak to your Nicola Wealth advisor for advice based on your unique circumstances.
Comparisons of the historical performance of Nicola Wealth funds or models to the historical performance of indexes, mutual funds or other investment vehicles should only be undertaken with consideration of the differences that exist between the underlying investments that comprise the compared investment vehicles. Indexes may be primarily composed of a single asset type/asset class (i.e. 100% equities or 100% bonds) whereas Nicola Wealth funds may or may not contain a combination of exchange-traded equities, marketable bonds, private investments, other alternative investment classes and exempt products. When making any comparison of historical performance, these differences and their impact on the performance of each comparable should be taken into account.
The Nicola Core Composite returns represent the total returns of Cdn. dollar-denominated accounts of all fee-paying portfolios with a Nicola Core mandate. The composite includes clients who are both fully discretionary and nondiscretionary. Historical net of fee composite performance returns are calculated using individual realized time-weighted client returns net of fees and is presented before tax. The Nicola Wealth inclusion policy is based on clients’ weights at calendar month end. The composite returns are asset-weighted based upon ending monthly market value. The Nicola Core mandate may change throughout time. Additional information regarding policies for calculating and reporting returns is available upon request. The composite returns presented represent past performance and is not a reliable indicator of future results, which may vary. Nicola Wealth Management Ltd. (Nicola Wealth) is registered as a Portfolio Manager, Exempt Market Dealer and Investment Fund Manager with the required securities commissions.

