

Nicola Wealth Market View
October tested the market’s confidence in artificial intelligence (AI). Shares of the companies most closely tied to the AI build-out fell as investors questioned how much more capital the build-out can attract and whether the spending will earn an adequate return. The technology-heavy Nasdaq 100 declined 6.6%, and the Nasdaq Composite recorded its worst month since March 2025. The S&P 500 returned –0.9% (total return, USD) while the S&P/TSX Composite gained 1.2% (total return, CAD).
Beneath the headline, this was a rotation more than a retreat. Investors moved toward steadier businesses such as consumer staples, long-time dividend payers, and low-volatility stocks. The S&P 500 Equal Weight Index, which gained 5.0% in October, pointed to strength in the broader market. Lenders also became more selective about financing AI projects. Treasuries, which offered little protection for much of the year, rallied as investors looked for safety.
The economy itself held up well. U.S. growth in the third quarter was the strongest in a year, and corporate earnings remained robust. Inflation, however, has proven sticky. The Federal Reserve held rates steady after a September hike, and the Bank of Canada raised its policy rate for the first time in more than three years, even as the Canadian economy slowed.
In our view, a pullback in AI-related stocks after such a strong run is not surprising, and we do not see October as a definitive sign that market leadership has changed. It is, however, a reminder that concentration works both ways. A diversified portfolio, including high-quality fixed income that now offers meaningfully higher yields, is built for periods like this one.
Key Takeaways
- AI-related stocks corrected as investors questioned the cost of the build-out and how it will be financed, with the Nasdaq 100 down 6.6% in October
- Steadier parts of the market led, including consumer staples, dividend payers, and low-volatility stocks
- Third-quarter S&P 500 earnings are expected to grow about 30%, though a handful of companies expected to account for most of that growth
- The 10-year Treasury yield reached a 24-year high early in the month, then fell below 5% as investors sought safety in bonds
- U.S. inflation rose to 3.7% in September, and the Fed held rates steady after its September hike
- The Bank of Canada raised its policy rate to 2.5% as Canadian growth and employment weakened
Chief Economist Rob Edel examines what drove October’s rotation, why lenders are asking harder questions about AI spending, and what both mean for long-term portfolios. Read the full commentary below.
AI stocks corrected as investors questioned the cost of the build-out
October was the month the market began to scrutinize the price tag of the AI build-out. The Nasdaq 100 fell 6.6%, and the Nasdaq Composite dropped 2.9% on the final trading day alone, capping its worst month since March 2025. By contrast, the S&P 500 Equal Weight Index gained 5.0%, and the Bloomberg US Aggregate Bond Index rose 2.4%.
The catalyst was third-quarter results from the four largest technology companies, often called hyperscalers: Amazon, Meta, Microsoft, and Alphabet. Their combined capital spending, mostly on chips and data centres, rose to about USD 207 billion in the quarter from USD 113 billion a year earlier, and they plan to spend another USD 232 billion in the fourth quarter. Investors responded by erasing nearly USD 900 billion of their combined market value after the reports, according to the Financial Times.
What unsettled investors was less the spending itself than how it is being paid for. Until this year, these companies funded investment from their substantial cash flows. Most have now begun to spend more than they generate and have turned to large bond and share offerings to close the gap. At the same time, revenue growth in some of their core businesses is slowing.
The question for investors has shifted. It is no longer whether AI is transformative. It is whether enough capital is available, at a reasonable cost, to fund the build-out, and whether that investment will earn an adequate return.

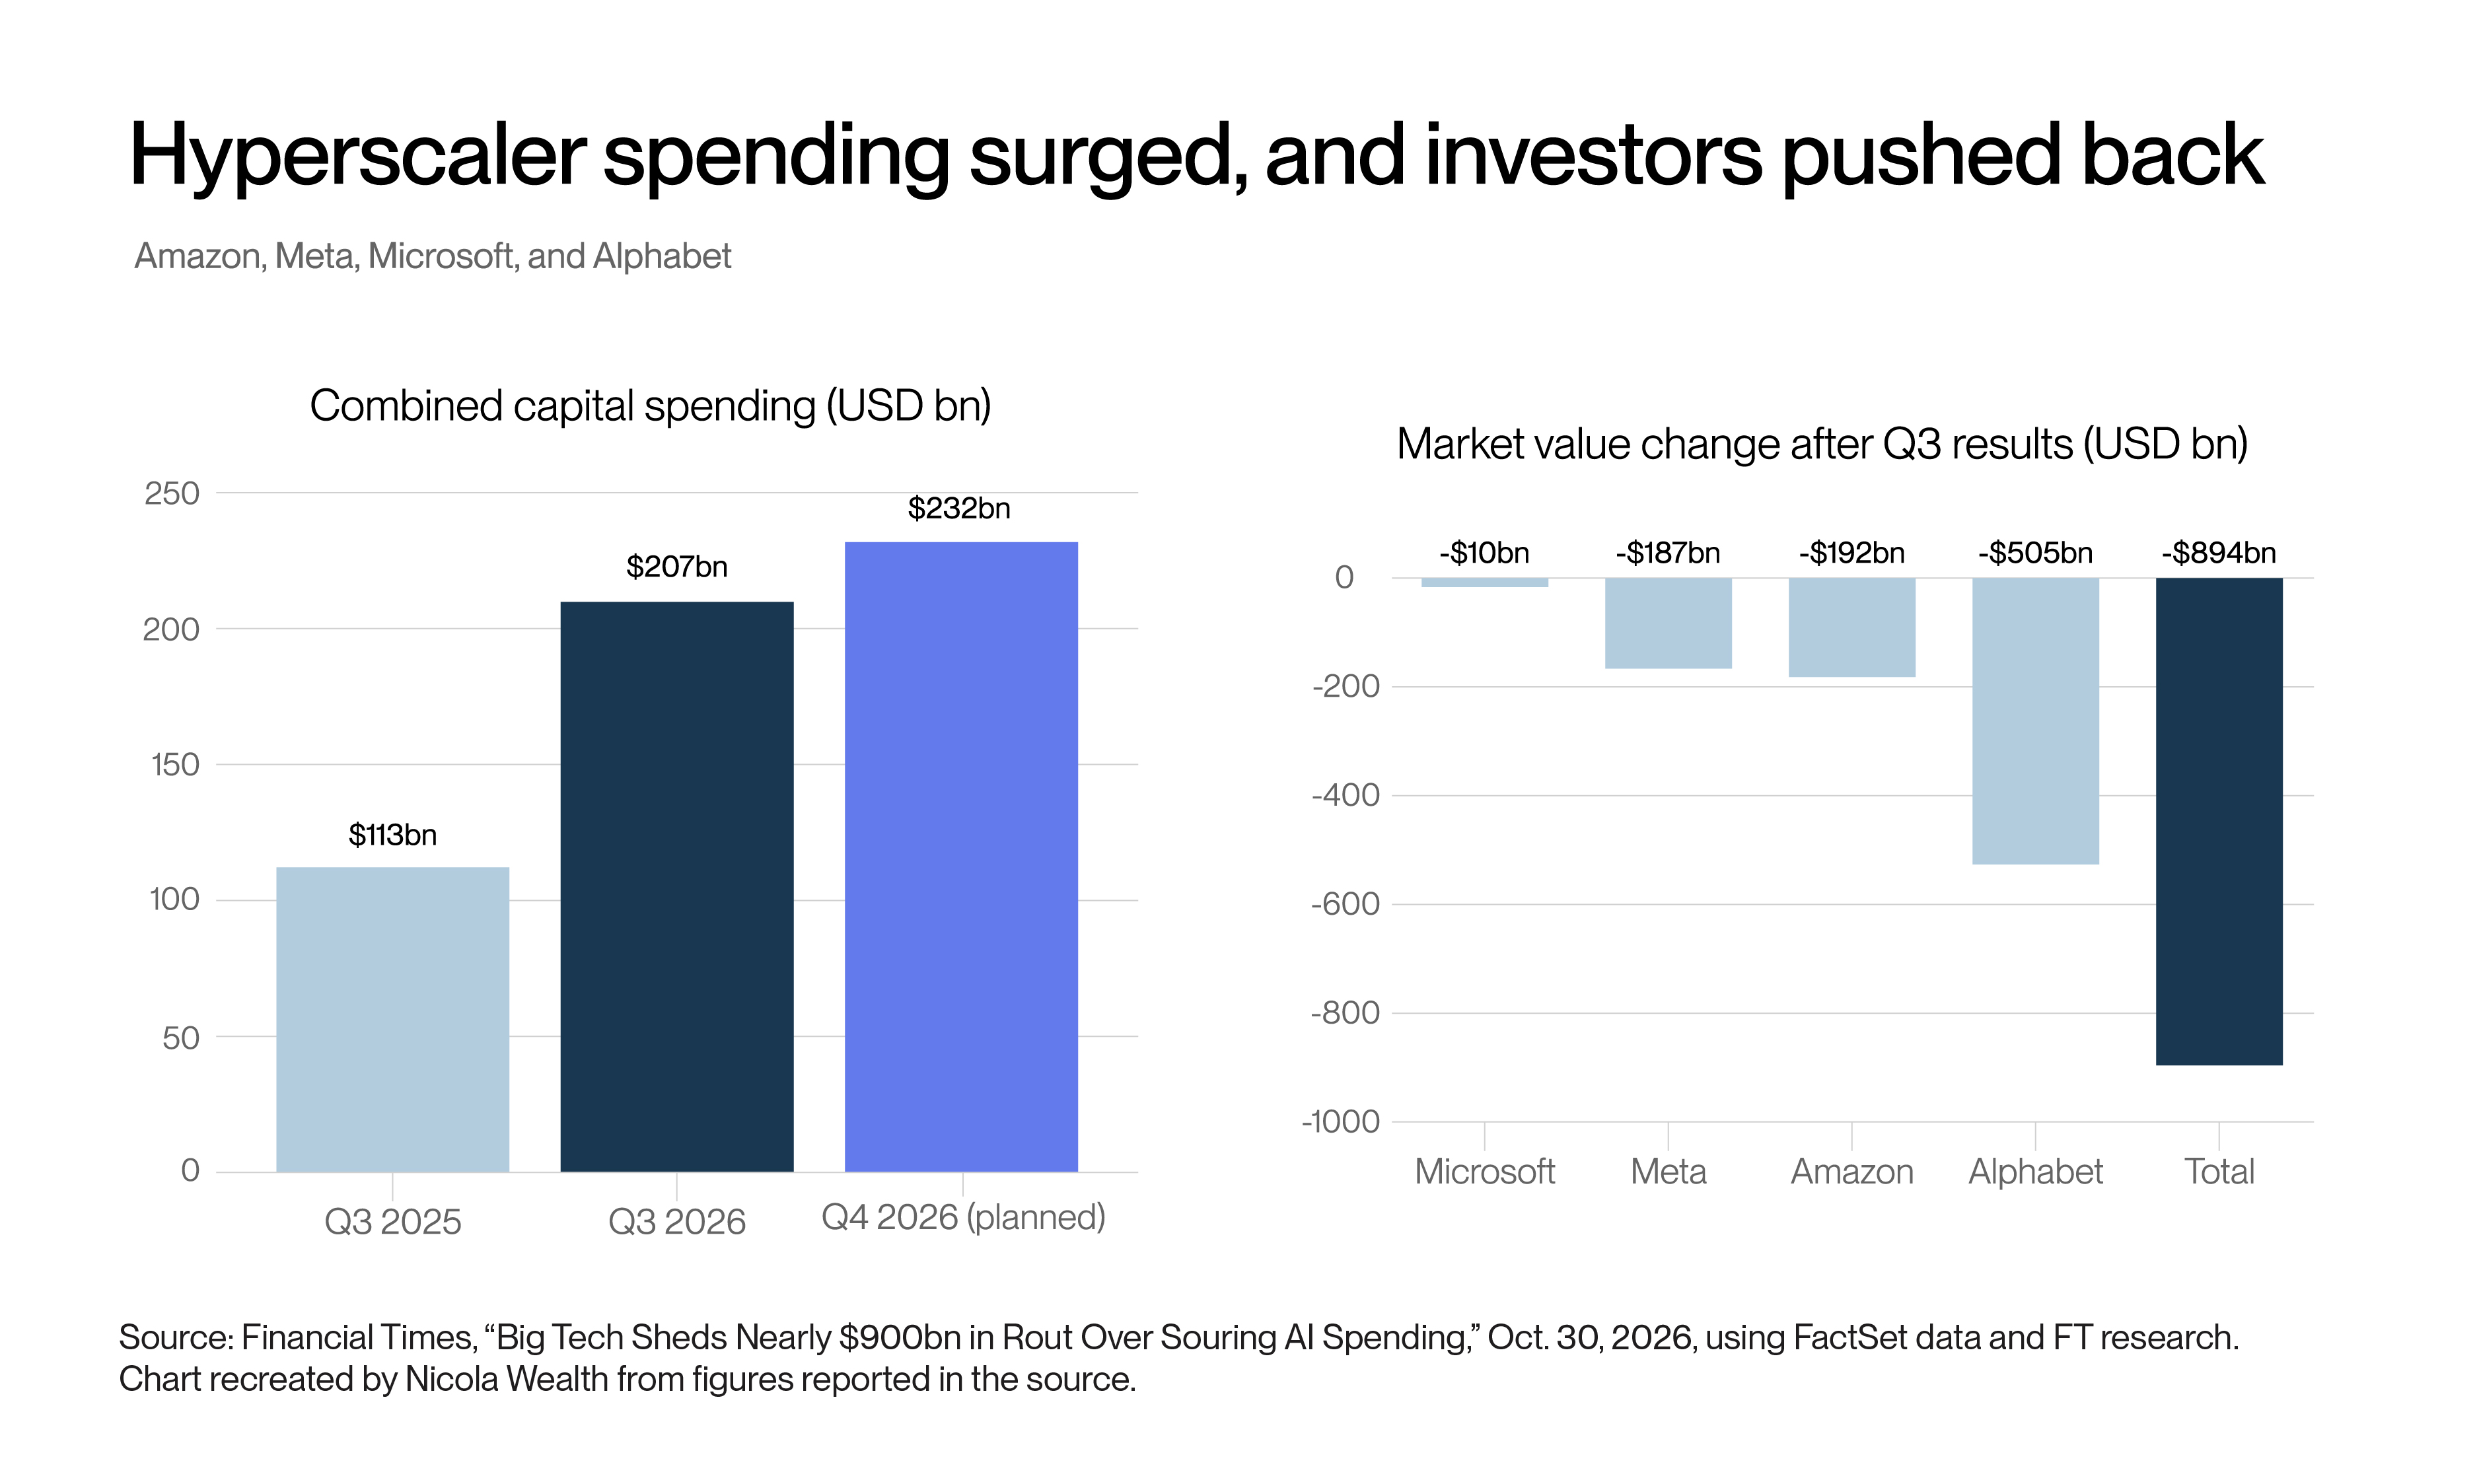
This chart shows the scale of the AI build-out and the market’s reaction to it. Capital spending nearly doubled from a year earlier, and investors marked down the four companies by almost USD 900 billion after their results.
Steadier stocks took the lead
While the market’s leaders stumbled, it’s less glamorous corners had a strong month. From the April 2025 low through the end of September, a basket of the most volatile S&P 500 stocks outperformed the least volatile by more than 120 percentage points. In October, that pattern reversed, with low-volatility stocks outperforming their more volatile counterparts by nearly 15 percentage points over four weeks. Consumer staples, Dividend Aristocrats (companies with long records of raising their dividends), and value stocks also performed well.
Rotation of this kind is a normal feature of markets, particularly after a period in which a narrow group of stocks has done most of the work. Portfolios that include steadier, income-producing businesses alongside growth companies tend to hold up better when leadership changes hands.


This chart shows how sharply leadership reversed. After high-beta stocks outperformed by a wide margin for more than a year, steadier, lower-volatility stocks led in October.
Lenders are starting to set the terms
Credit markets may be sending the more important signal. Lenders and investors have become more selective about financing AI projects and are demanding stricter terms. According to the Wall Street Journal, bonds issued by some large technology companies traded at notable discounts Several of the specialized AI cloud providers known as neoclouds, which borrow heavily to build and lease computing capacity, were also effectively shut out of the bond market in recent weeks. The cost of insuring against default on debt issued by the largest hyperscalers rose to its highest level since 2021.
The scale of borrowing helps explain the caution. AI-linked debt issuance across U.S. corporate markets reached USD 655 billion through mid-October, compared with USD 394 billion in all of 2025, and analysts expect close to USD $1 trillion next year, according to Bank of America data.
Not all of this activity reflects a loss of conviction. Some of the recent demand for protection has come from investors and executives who have made substantial gains on AI-related holdings. They are hedging, in effect buying insurance, rather than selling outright. Hedging can also allow lenders to reduce their exposure so that they can continue to lend.
Stress is more visible at the weaker end of the credit market. Spreads on the lowest-rated corporate bonds (rated CCC) have widened to levels that signal distress, as refinancing becomes more expensive for the most heavily indebted borrowers.


This chart shows why lenders have become more selective. AI-related borrowing in 2026 has already far exceeded last year’s total, and analysts expect it to approach USD 1 trillion in 2027.
Earnings remain strong, but growth is narrow
Earnings continue to support the market. Analysts expect S&P 500 companies to report third-quarter profit growth of about 30% from a year earlier, according to FactSet. Because earnings have grown faster than share prices, stocks look less expensive than they did at the start of the year, even as the index traded near record levels earlier in the month.
The growth, however, is highly concentrated. Two AI chipmakers, Nvidia and Micron, are expected to account for about 34% of the expected increase, and just 10 companies account for roughly two-thirds of it. The rest of the index is still expected to grow profits by about 10%, a respectable result in its own right.
The pace is also expected to moderate. Bloomberg Intelligence data show analysts expect S&P 500 earnings growth to slow to 18% in the first half of 2027, and 10 of the 11 sectors are expected to report slower growth than in the prior quarter than in the second.


The left panel shows how much of the market’s earnings growth rests on its 10 largest contributors. The right panel shows that growth is expected to moderate next year. Estimates differ by provider, so the two panels are not directly comparable.
Will the spending pay off?
The broader question is whether AI investment will earn an adequate return. Gartner estimates that AI data centre owners would need to generate USD 8.5 trillion in cumulative revenue through 2030 to cover their costs and earn a 12% return on invested capital. Its forecast for AI revenue over the same period is no more than USD $3.6 trillion, which leaves more than USD $3.5 trillion of infrastructure spending at risk of being written down.
The build-out is also running into physical and political limits. At least 47 large data centre projects have been delayed, withdrawn, or blocked this year, according to data cited by the Financial Times. A Washington Post-ABC News-Ipsos poll found that significant majorities of Americans oppose the construction of new data centres, and majorities of both Republicans and Democrats want more federal regulation of AI.
Even so, the spending is not slowing. The Brookings Institution estimates USD 10.3 trillion of AI-related investment between 2025 and 2032, and hyperscaler capital spending is projected to exceed USD 800 billion in 2026. Bloomberg strategist Simon White argues that AI stocks can correct without derailing the investment cycle itself, provided the risk of a near-term recession remains low.
In our view, the gap between what is being invested and what can be confidently forecast in revenue is the central uncertainty for markets. It does not have to resolve quickly, and it may not resolve badly. It does argue against concentrating portfolios in the companies most exposed to the outcome.


This chart frames the question markets began asking in October. The investment case for AI depends on revenue that has not yet materialized, which is why financing terms and investor patience have become so important.
Bond yields hit a 24-year high, then Treasuries rallied
Bond markets were volatile. The 10-year U.S. Treasury yield reached 5.36% in early October, its highest level in 24 years and up from 4.80% at the start of September. By month-end, it had fallen back below 5%. On October 22, the 10-year yield fell 0.19 percentage points in a single day, its largest one-day drop since March 2023, as investors sold technology shares and bought bonds.
That move matters for portfolios. For much of this year, Treasuries offered little protection when stocks stumbled, because rising inflation and interest rates pushed stock and bond prices down together. In late October, the traditional relationship reappeared, with bonds rising as AI-related stocks fell.
Higher yields have drawn attention from policymakers and investors alike. The International Monetary Fund identified surging government bond yields as the biggest emerging risk to the global financial system, ahead of a possible correction in AI-related assets. In Bank of America’s October Fund Manager Survey, 37% of respondents said a 10-year yield of 6% would prompt them to move from stocks to bonds, while 19% said they were already shifting.
Much of the rise in U.S. yields has come from real (inflation-adjusted) yields, reflecting expectations of stronger growth rather than concerns about government finances. That distinction is constructive for stocks, provided earnings expectations hold up. Elsewhere, the picture is less benign. France’s 10-year yield rose above 5% for the first time since 2002, a reminder that markets are increasingly testing governments with high debt and limited political room to address it.
U.S. growth accelerated, but the cracks are visible
The U.S. economy grew at an annualized 3.4% in the third quarter, its fastest pace in a year. Business investment, largely tied to AI, and household spending, which rose at an annualized 3.8% for a second straight quarter, did most of the work. Spending on equipment contributed more to growth than at any time since 2011, outside the pandemic rebound.
There are visible cracks, however. Employers added just 29,000 jobs in September, missing all forecasts, and the unemployment rate rose to 4.2%. Context matters here. With immigration down sharply and baby boomers retiring, Apollo Global Management estimates the number of new jobs needed each month to keep unemployment steady has fallen from roughly 200,000 to close to zero. By that measure, slow hiring is less concerning than it once would have been, and layoffs remain low.
Consumers continue to spend despite elevated prices. Inflation-adjusted spending rose 0.6% in August, the largest monthly increase since March 2025. The Conference Board’s consumer confidence index improved to 91.7 in October from 84.2 as gasoline prices eased, although confidence remains on a long-term downward trend.
Their support from financial conditions is also fading. Until recently, higher stock prices, tight credit spreads, and a weaker U.S. dollar offset the drag from higher rates. Goldman Sachs now expects higher rates to subtract about 0.2 percentage points from U.S. growth in 2027, rising to slightly more than 0.5 percentage points if rates stay at current levels.
Inflation proved stickier than expected
U.S. consumer prices rose 0.6% in September, the fastest pace in five months, lifting annual inflation to 3.7% from 3.4% in August. Core inflation, which excludes food and energy, rose to 2.6% from 2.4%. Producer prices, which track the costs businesses face, rose 1.3% in the month, the most since March 2022.
Energy remains the main driver, but not the only one. Services inflation ran at 3.2% over the year to September, which suggests price pressures extend beyond the sectors most affected by tariffs and the conflict in Iran. Households have noticed. The New York Fed’s survey showed one-year-ahead inflation expectations rising to 3.9%, the highest since May 2023. Average hourly earnings, meanwhile, grew just 3% over the past year, below the pace of inflation.
The Fed paused after its September hike, but the debate is not settled
The Federal Reserve raised its policy rate in September for the first time in three years, then held it steady in a range of 3.75% to 4% at its late-October meeting. A move just days before the November 3 midterm elections had been widely viewed as unlikely, and officials signalled in public remarks that they were in no hurry to act again.
Views on what comes next differ. In projections submitted in September, most Fed officials pencilled in one more increase this year. Markets and some economists lean toward more. By month-end, futures were pricing roughly 75% odds of a December hike, and several analysts added a further increase early next year after the September inflation data. Goldman Sachs’ baseline is one more hike in December, followed by cuts beginning in the second half of 2027.
Part of the challenge is that today’s inflation does not resemble that of a typical overheating economy. Much of it reflects supply constraints, including energy and the strain the AI build-out places on power, chips, and labour. Higher rates cannot directly fix these constraints. A Federal Reserve survey cited by Apollo found only 19% of firms said financing costs or access to credit are constraining their investment plans, suggesting policy is not yet especially restrictive. AI investment and oil prices, two of the economy’s main drivers, are also relatively insensitive to interest rates.
For investors, the practical implication is that the path of short-term rates remains uncertain, and that uncertainty is likely to keep bond markets volatile.
Oil: more supply, but no resolution
Oil prices remained elevated as the conflict with Iran threatened to escalate again. Brent crude ended October near $118 a barrel as reports emerged of potential U.S. plans to resume attacks.
Supply has proven more resilient than many expected. Middle East oil flows averaged more than 24 million barrels a day in the week through October 18, above pre-war levels of 23.3 million. A shipping system operating under U.S. protection and regional pipelines kept oil moving. That resilience comes at a cost. Around 30 attacks on ships were reported in October and war-risk insurance has climbed to as much as 10% of a vessel’s value, leaving traders to question whether current flows are sustainable.
Refined fuels remain the tightest part of the market. Damage to refineries has left the world short of diesel, with the U.S. national average reaching a record USD $6.53 a gallon in late September. Because diesel moves goods across the economy, its price feeds into the cost of nearly everything consumers buy.
Pressure on Iran is building as well. Its floating oil reserves in Asian waters were fully depleted by mid-October under the U.S. blockade, which U.S. Central Command says has denied Tehran at least USD 25 billion in revenue. That increases the incentive to negotiate but may also raise the risk that Iran escalates to regain leverage. We continue to treat forecasts for oil prices with caution.
Canada: the Bank of Canada raises rates into a slowing economy
The Bank of Canada raised its overnight rate by 0.25 percentage points to 2.5%, its first increase in more than three years, and said further increases may be needed. Governor Tiff Macklem cited the risk that high energy prices could spread to the prices of other goods and services. The Bank now expects inflation of 3.1% in 2027, up from its previous forecast of 2.0%.
The decision followed a Bank of Canada survey showing a sharp rise in inflation expectations among Canadian businesses, linked to elevated fuel costs and new tariffs on goods traded between Canada and the U.S. Firms now expect inflation of 3.7% in the third quarter of 2027. Consumer prices rose 3.1% in September from a year earlier, while core inflation was a more modest 2.1%.
The economy, meanwhile, is losing momentum. Employment fell by 68,300 in September, and the unemployment rate rose to 6.5%. Job losses in August and September totalled 110,000, the first months to reflect new 50% U.S. tariffs on a range of Canadian goods. Third-quarter growth is tracking 1.3% annualized, below the Bank’s 2% estimate. The Canadian dollar, for its part, strengthened almost 2% against the US dollar in October.
In our view, the case for higher rates in Canada is less compelling than in the U.S., though we also question whether further tightening is needed south of the border as well. Growth is not particularly strong in Canada, and inflation is being driven largely by oil, a supply shock that higher rates cannot fix. Longer-term inflation expectations appear stable, even as near-term expectations have risen. Inflation in Canada is also far less broad-based: CIBC finds only 38% of major components of Canada’s consumer price index are rising faster than 3%, compared with about half of U.S. consumer spending categories.


This chart shows the tension in the Bank of Canada’s decision. Growth is running below the Bank’s own estimate, yet its inflation forecast for 2027 has risen well above the 2% target.
Echoes of 2018
Today’s market has parallels to 2018. Then, as now, President Trump faced the prospect of a Democratic “blue wave” in the midterm elections, a new Fed chair had recently taken office, market expectations for the year-end policy rate rose sharply, and corporate earnings were resilient. That year ended with a sharp selloff in December, followed by a strong recovery in 2019 after the Fed changed course, as Bloomberg columnist John Authers recently noted.
History rarely repeats exactly, however. Today’s backdrop includes higher inflation, higher yields, and an oil shock with no counterpart in 2018. The comparison is less a forecast than a reminder that volatility around elections and policy shifts has often given way to recovery for patient investors.
What this means for long-term investors
Through much of 2026, markets have balanced two forces: the drag from higher interest rates and the boost to growth and earnings from AI investment. In October, AI took centre stage as the durability of that investment came under closer scrutiny. Earnings were largely solid and capital spending plans remain robust, but markets are questioning the availability of financing and the future profitability of the build-out more seriously. Some of the selling likely reflected profit-taking and hedging by investors managing their risk.
We are not surprised by the pullback after such a strong rally, and we do not view October as a definitive sign of a change in market leadership. Professional investors are divided. In Barron’s fall Big Money poll, half of managers were bullish on U.S. stocks over the next 12 months. Asked about the biggest risk over the next six months, 27% named a potential AI slowdown and an equal 27% cited rising interest rates.
Bond yields could move lower if U.S. growth weakens. Lower inflation would be the most important driver, and any sign of an end to the conflict in Iran, or a sustained decline in oil prices, could bring yields down with it. Over the longer term, however, heavy government borrowing and rising debt are likely to keep upward pressure on yields. The recent rise in French yields shows how markets can respond when a government’s debt grows unsustainably and the political will to stabilize it is lacking.
These developments reinforce principles we have long held. Concentration raises the cost of being wrong about a small number of companies. Higher yields make high-quality fixed income a meaningful source of income and ballast again, as late October demonstrated. And when the range of possible outcomes is wide, the most reliable response is a diversified portfolio built to hold up across as many of them as possible.
Disclaimer
This material contains the current opinions of the author, and such opinions are subject to change without notice. This material is distributed for informational purposes only and is not intended to provide legal, accounting, tax or specific investment advice. Forecasts, estimates, and certain information contained herein are based upon proprietary research and should not be considered as investment advice or a recommendation of any particular security, strategy, or investment product. Information presented here has been obtained from sources believed to be reliable, but not guaranteed. Nicola Wealth Management Ltd. (Nicola Wealth) is registered as a Portfolio Manager, Exempt Market Dealer, and Investment Fund Manager with the required securities commissions. All values sourced through Bloomberg, unless otherwise specified.

